
Most of us have been there. A problem shows up on the shopfloor and the first instinct is to pull out something complex, a sophisticated analysis tool, a heavy methodology, something that looks serious. And if you trace back why we do that, it usually comes down to status quo, wanting to look competent, or chasing whatever’s trending. Those complex tools do deliver results no argument there but somewhere along the way we convinced ourselves that simple means ineffective.
That’s the real problem.
Most shopfloor problems I’d say more than 80% of daily operational issues don’t need complex tools. What they need is the right approach. The right sequence. And we already have exactly that. It’s the 7QC tools. They’ve been sitting there the whole time.
I’m not going to walk you through what each tool does. You already know that. What I want to talk about is how to use them together, because that’s where most people go wrong.
The mistake isn’t the tool — it’s the isolation
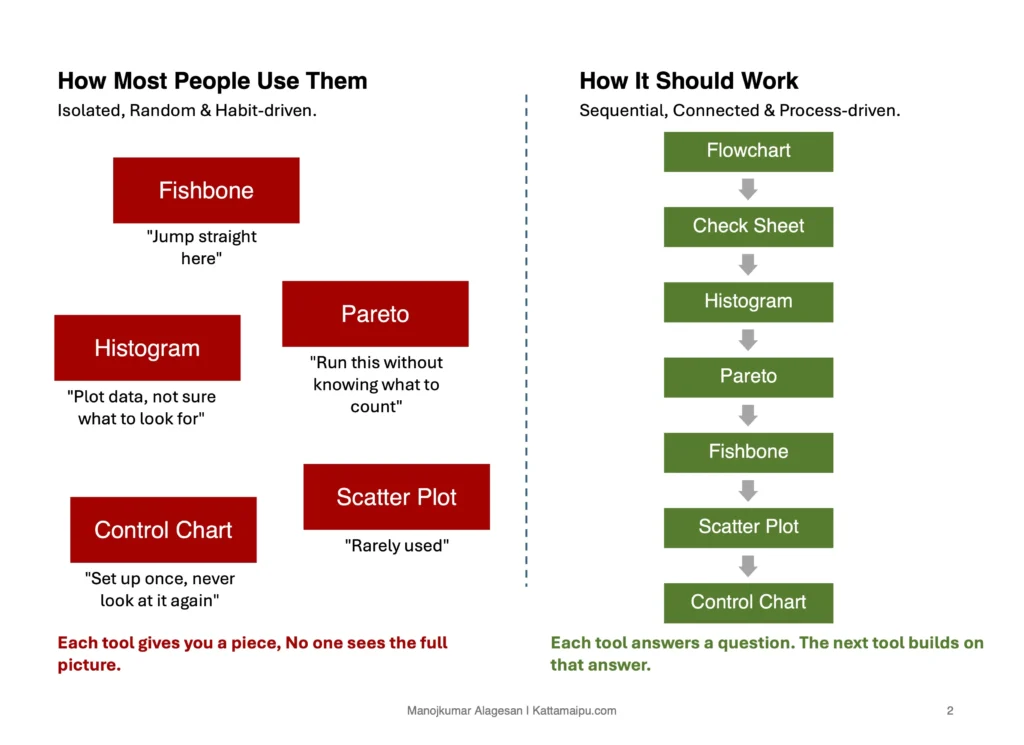
Here’s what usually happens. Problem comes in, someone jumps straight to a fishbone. Someone else pulls a Pareto without knowing what data to collect. Another person runs a histogram on the wrong variable. Each tool used alone, in no particular order, driven by habit or personal preference.
And then people wonder why the results don’t stick.
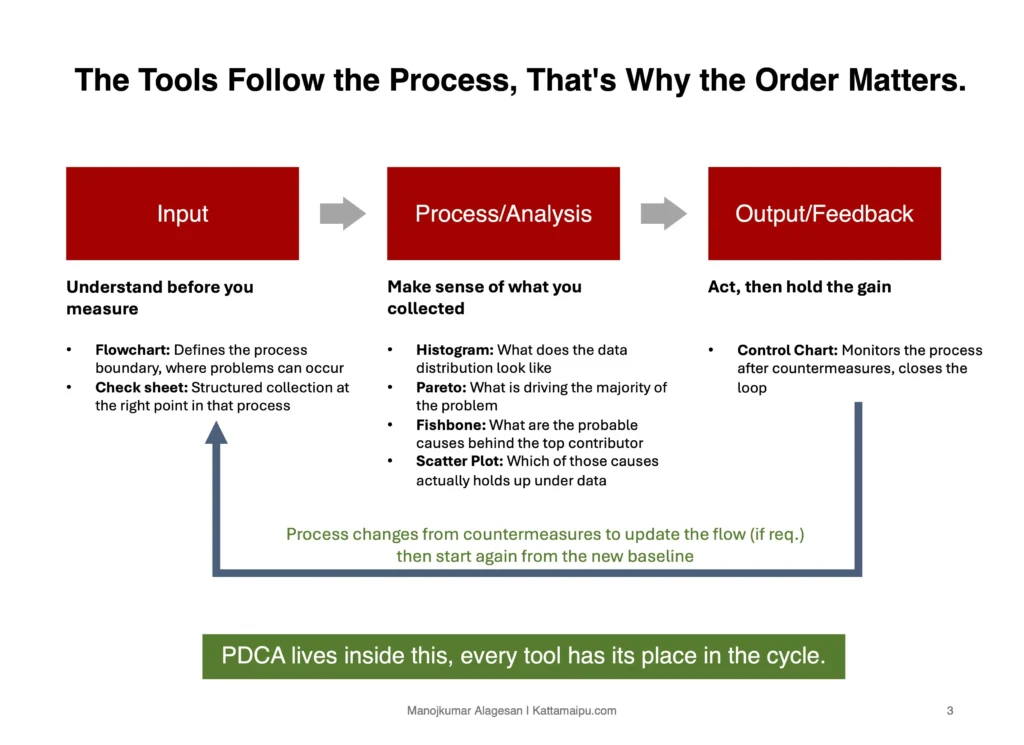
These tools aren’t standalone instruments. They’re a sequence. Everything in a process follows Input → Process → Output, with feedback loops connecting it all. The 7QC tools work the same way, each one feeds the next. Break that chain and you’re just doing analysis theater.
Start before the data — with the flow
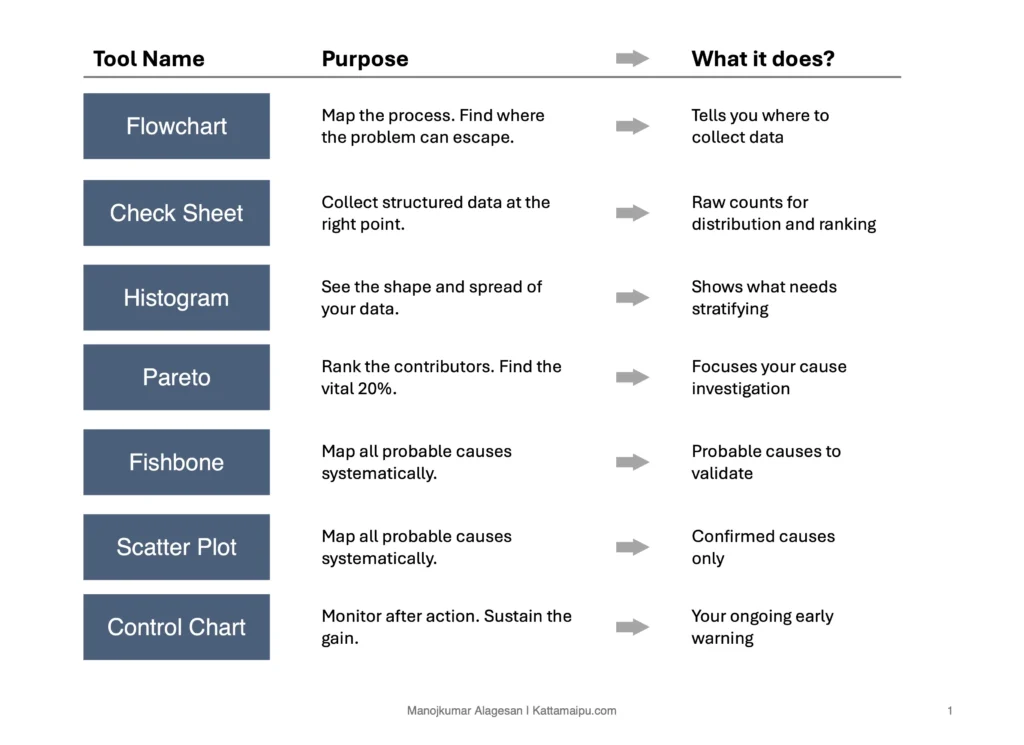
Before you touch any data, draw the process Flowchart first. This tells you where the problem lives inside the process, where the possible escape points are, where you should even be looking. Without this, your data collection is guesswork.
Once you know where to look, then you collect structured, deliberate data collection using a Check sheet, not a random data but targeted data.
Now you have data, run it through a Histogram. You’re not looking for answers yet, you’re looking at the shape of the problem like spread, central tendency, whether it’s even a single problem or multiple stacked on top of each other.
Then Pareto, out of everything showing up, what’s carrying 80% of the weight? This is where you stop chasing everything and start focusing.
Now, and only now, go to the Fishbone. Because now you’re not brainstorming causes blindly. You’re investigating the high-contribution items from your Pareto. Every branch on that fishbone is connected to something real, not something assumed.
Once you have probable causes, validate them using Scatter Plot. Does this cause actually correlate with the effect? This is the step most people skip, and it’s exactly why countermeasures don’t hold.
After you’ve confirmed the root cause and implemented action, then comes the Control Chart, not to prove you solved it but to prove you have sustained it and to catch drift before it becomes a problem again.
That’s the sequence, same tools you already know, but different result when you respect the order they belong in.
The tools were never the problem, but how they were used is.
To make this easier to apply directly, I’ve put together a ready-to-use Excel template with all 7 tools built in sequence — Flowchart mapping table, Check sheet with auto-totals, Histogram with frequency distribution chart, Pareto with the 80/20 line, Fishbone with 6M framework, Scatter Plot with correlation calculation, and a Control Chart with UCL/LCL plotted automatically.
Yellow cells are your inputs. Everything else calculates on its own.
Download it, map it to your current problem, and run through the sequence.